
If a human population is in the expanding state, what will be the structure of its age pyramid?
Answer & explanation
Correct answer: option 2
The correct answer is Option (2) → 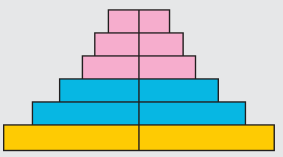
An age pyramid shows the per cent of individuals in each age group, from pre-reproductive at the bottom, through reproductive, to post-reproductive at the top. Its shape shows the growth status of the population. In a growing (expanding) population the young, pre-reproductive group is the largest, so the pyramid has a broad base and narrows steadily to the top.
Option (1) — Incorrect. Its base is narrower than its middle: there are fewer young people than adults of reproductive age. This is the declining pyramid.
Option (2) — Correct. The pre-reproductive bar is the widest of all and each older group is smaller. Many young people will soon enter the reproductive age, so the population keeps growing.
Option (3) — Incorrect. The lower bars are nearly equal in width, so the young group only replaces the reproductive group. This is the stable pyramid.
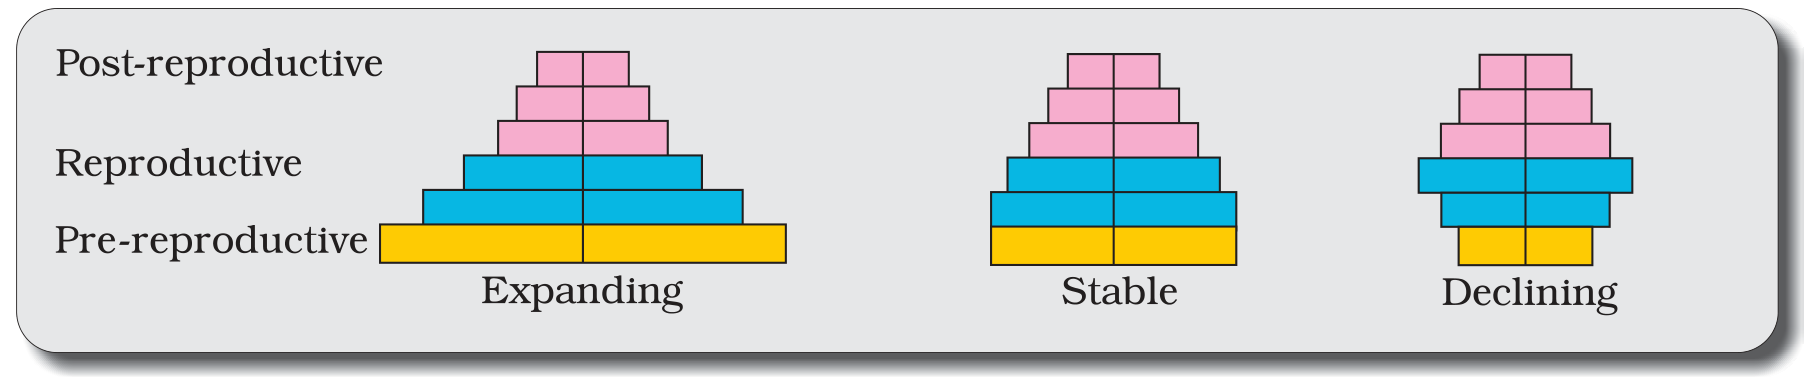
Figure 11.1 Representation of age pyramids for human population
Note: Three coloured stacks of bars in one figure carry a full question. Treat the NCERT figures as part of the text, because NTA certainly does.
NCERT Extract:
Population Attributes – “… A population at any given time is composed of individuals of different ages. If the age distribution (per cent individuals of a given age or age group) is plotted for the population, the resulting structure is called an age pyramid (Figure 11.1). For human population, the age pyramids generally show age distribution of males and females in a diagram. The shape of the pyramids reflects the growth status of the population - (a) whether it is growing, (b) stable or (c) declining.”