CUET Preparation Today
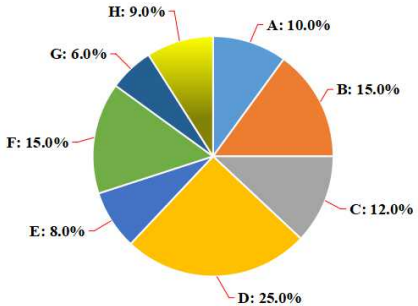
The following pie chart shows the number of workers of different categories A, B, C, D, E, F, G and H of a factory in 1995.
If the number of workers in category B is increased by 10% and the number of workers in category D is decreased by 5% in 1996, then what is the total no. of workers in categories B and D in 1996, if no. of workers in B was 1500 in the year 1995? |
4025 4500 5000 4000 |
4025 |
ATQ, 15% of total workers = 1500 Total number of workers = 10000 Number of workers in D = 25% of 10000 = 2500 In 1996 , Number of workers in D = 2500 - \(\frac{1}{20}\) × 2500 = 2375 Number of workers in B = 1500 + \(\frac{1}{10}\) × 1500 = 1650 Total number in 1996 in B & D = 2375 + 1650 = 4025
|