CUET Preparation Today
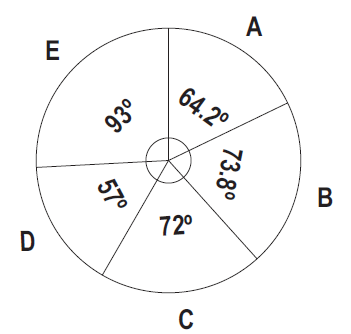
Study the given graph and answer one questions that follows. Degree wise distribution of no. of students working in Class (A, B, C, D and E) Total no. of students = 3000
The number of students of Class A and Class B is what percent more or less than no. of students of class C and D. |
5.47% 6.97% 7.77% 8.67% |
6.97% |
Total students of A and B (in degree) = 64.2° + 73.8° = 138° Total students of Class C and D (in degree) = 129° Students of C and D is less than A and B by 138° - 129° = 9° ⇒ Req. Percentage = \(\frac{9}{129}\) × 100% = 6.97% |