
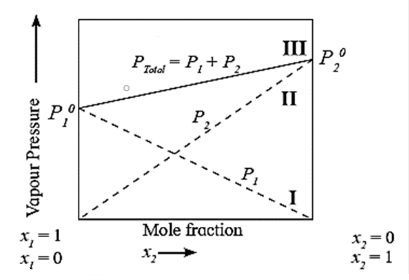
Observe the given graph and identify the correct statement for the solution.
Answer & explanation
Correct answer: option 1
The correct answer is Option (1) → Component 2 is more volatile than component 1
The graph is the vapour pressure–composition plot of an ideal solution. The ends of the total pressure line give the vapour pressures of the pure liquids: at x1 = 1 the pressure is p10, and at x2 = 1 it is p20. The line rises from left to right, so p20 > p10.
A liquid with the higher vapour pressure at the same temperature escapes into the vapour more easily, so component 2 is the more volatile one and has the lower boiling point.
Why the other options are incorrect
Option (2) — Incorrect. The reverse; component 1 has the lower vapour pressure.
Option (3) — Incorrect. The less volatile component 1 has the higher boiling point.
Option (4) — Incorrect. The partial pressure of a component depends on its mole fraction (p1 = x1p10), but its volatility is set by p0 of the pure liquid, which does not change with composition.