CUET Preparation Today
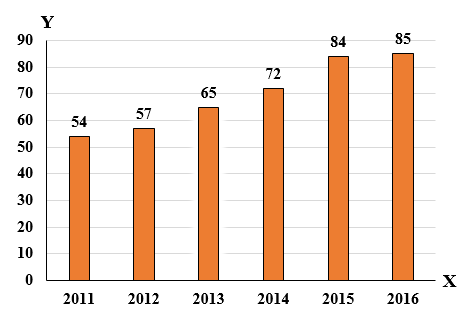
The given bar diagram represents the number of persons who have taken an insurance policy on the y-axis, and the year of purchase of the insurance policy on the x-axis.
What is the average number of persons who have taken the insurance policy, excluding in the year 2012 ? |
72 60 70 62 |
72 |
Average number of person taking insurance policy in all years excluding 2012 = \(\frac{54 + 65 + 72 + 84 + 85}{5}\) = \(\frac{360}{5}\) = 72 |