CUET Preparation Today
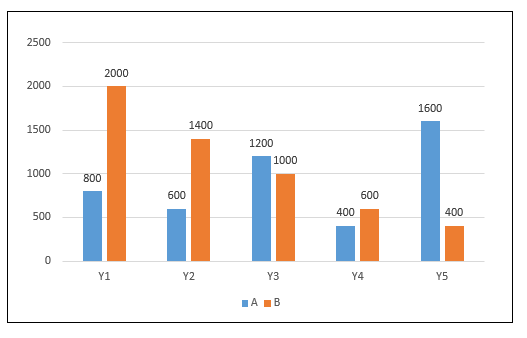
The bar graph given below shows the expenditure of two companies A and B in different years.
T1 = The average expenditure of company A and B in year Y1. T2 = The average expenditure of company A and B in years Y5. What is the value of (T1- T2 )?
|
200 600 400 500 |
400 |
T1 = The value of average production of A and B in Y1 = \(\frac{2000 + 800}{2}\) = 1400 T2 = The value of average production of A and B in Y5 = \(\frac{1600 + 400}{2}\) = 1000 Now , (T1 - T2) = 1400 - 1000 = 400 |