CUET Preparation Today
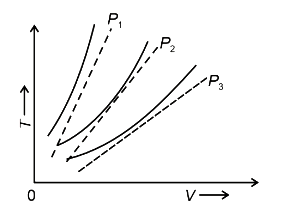
The following graph represents the $T-V$ curves of an ideal gas (where $T$ is the temperature and $V$ the volume) at three pressures $P_1, P_2$ and $P_3$ compared with those of Charles's law represented as dotted lines.
Then the correct relation is : |
$P_3> P_2> P_1$ $P_1> P_3> P_2$ $P_2> P_1> P_3$ $P_1> P_2> P_3$ |
$P_1> P_2> P_3$ |
The correct answer is option (4) : $P_1> P_2> P_3$ At same temperature, curve with higher volume corresponds to lower pressure. $V_3> V_2> V_1$ $⇒P_1> P_2> P_3$ (We draw a straight line parallel to volume axis to get this) |