CUET Preparation Today
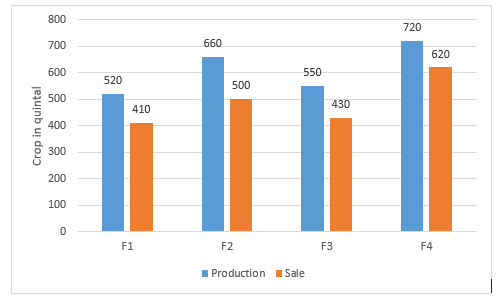
The given bar graph represents the production and sales of a certain crop in quintals by the farmers F1, F2, F3 and F4.
What is the ratio between the total sales and total production by all farmers? |
4 : 5 5 : 6 3 : 4 6 : 7 |
4 : 5 |
Total sale : Total production ( 410+500+430+620 ) : ( 520+660+550+720 ) 1960 : 2450 4 : 5 |