CUET Preparation Today
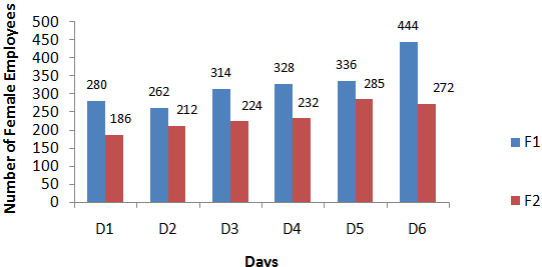
The Bar graph given below presents the number of female employees working in two factories on six different days of a week.
What is the difference (correct up to two decimal places) in the average number of females working per day in a factory F1 and the average number of females working per day in a factory F2? |
125.33 96.25 92.17 87.33 |
92.17 |
Average number of females working in F1 = \(\frac{280 + 262 + 314 + 328 + 336 + 444}{6}\) = \(\frac{ 1964}{6}\) Average number of females working in F2 = \(\frac{186 + 212 + 224 + 232 + 285 + 272 }{6}\) = \(\frac{1411}{6}\) Difference in average females working in F1 & F2 = \(\frac{ 1964}{6}\) - \(\frac{1411}{6}\) = \(\frac{553}{6}\) = 92.17 |