CUET Preparation Today
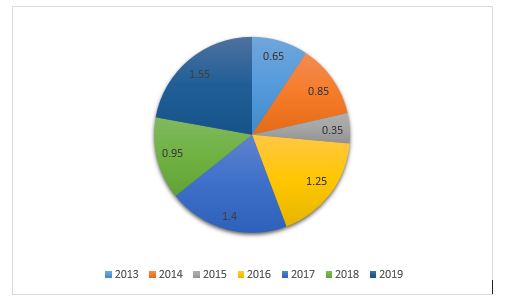
The following pie chart shows the ratio of the amount of imports by a company to the amount of exports from that company from 2013 to 2019.
If the imports in 2016 were ₹250 million and the total exports in the years 2016 and 2017 together were ₹500 million, then the imports in 2017 were: |
₹320 million ₹420 million ₹520 million ₹620 million |
₹420 million |
Imports in 2016 = 250 million Ratio of imports to exports in 2016 = 1.25 = \(\frac{125 }{100}\) = \(\frac{5 }{4}\) ATQ , 5R = 250 1R = 50 Export in 2016 = 50 × 4 = 200 Sum of export in 2016 and 2017 = 500 million So , Export in 2017 = 500 - 200 = 300 million In 2017 ration of import to export = 1.4 = \(\frac{140}{100}\) = \(\frac{7}{5}\) As , Export in 2017 = 300 million i.e. 5R = 300 1R = 60 So , Import in 2017 = 7R = 7 × 60 = 420 million |