CUET Preparation Today
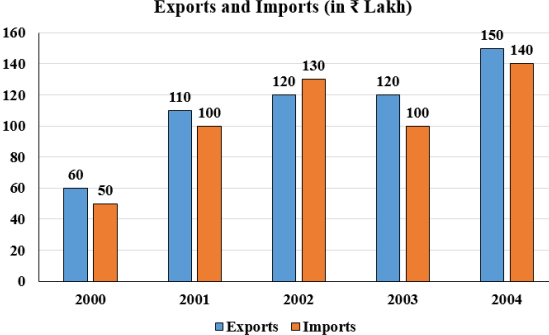
Study the given bar-graph and answer the question that follows. The bar-graph shows the exports and imports (in ₹lakh) of a company from 2000-2004.
What is the average export (in ₹lakh) from the year 2000 to 2004? |
100 125 112 130 |
112 |
Average export from 2000 to 2004 = \(\frac{60 + 110 + 120 + 120 + 150}{5}\) = \(\frac{560}{5}\) = 112 |