CUET Preparation Today
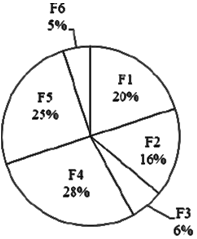
The pie chart given below shows the production of 6 different factories. The total production of all these 6 factories is 15000. The production of a particular factory is shown as a percent of total production of all these 6 factories.
J1 = The value of average production of factory F3 and F6. J2= The difference between the production of factory F1 and F4. What is the value of (J2 - J1)? |
385 395 375 305 |
375 |
Total production of F3 & F6 = ( 6 + 5 )% = 11% of 15000 = 1650 J1 = Average of F3 & F6 = \(\frac{1650}{2}\) = 825 Total production of F1 = 20% of 15000 = 3000 Total production of F4 = 28% of 15000 = 4200 J2 = Difference of F1 & F4 = 4200 - 3000 = 1200 Now , ( J2 - J1) = 1200 - 825 = 375 |