CUET Preparation Today
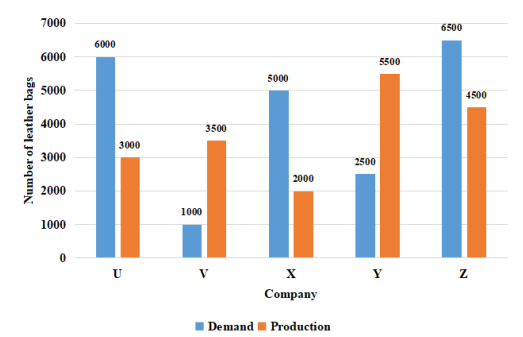
Study the graph and answer the question that follows. The given chart represents the demand and production of leather bags of five companies U, V, X, Y and Z.
If the production of leather bags by company Y is equal to 'm' times of the production of leather bags by company X. then the value of 'm' is: |
3.25 2.75 3 2.5 |
2.75 |
Production of leather bags by company Y = 5500 Production of leather bags by company X = 2000 Production of leather bags by Y is what times of X (m)= \(\frac{5500 }{2000}\) = 2.75 m = 2.75 |