CUET Preparation Today
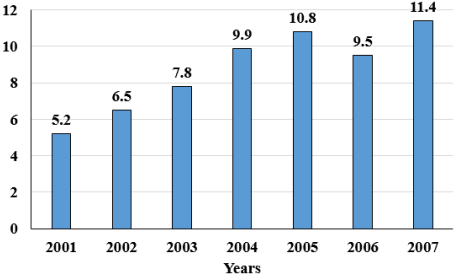
The following bar graph describes the population of a town (in lakhs) from 2001 to 2007.
Find the percentage increase in population from 2006 to 2007. |
15% 20% 16% 18% |
20% |
Percentage increase in population from 2006 to 2007 = \(\frac{11.4 - 9.5}{9.5}\) × 100 = \(\frac{ 1.9}{9.5}\) × 100 = 20% |