The shape of the average fixed cost curve is ______.
Answer & explanation
Correct answer: option 2
The correct answer is Option (2) → Rectangular hyperbola
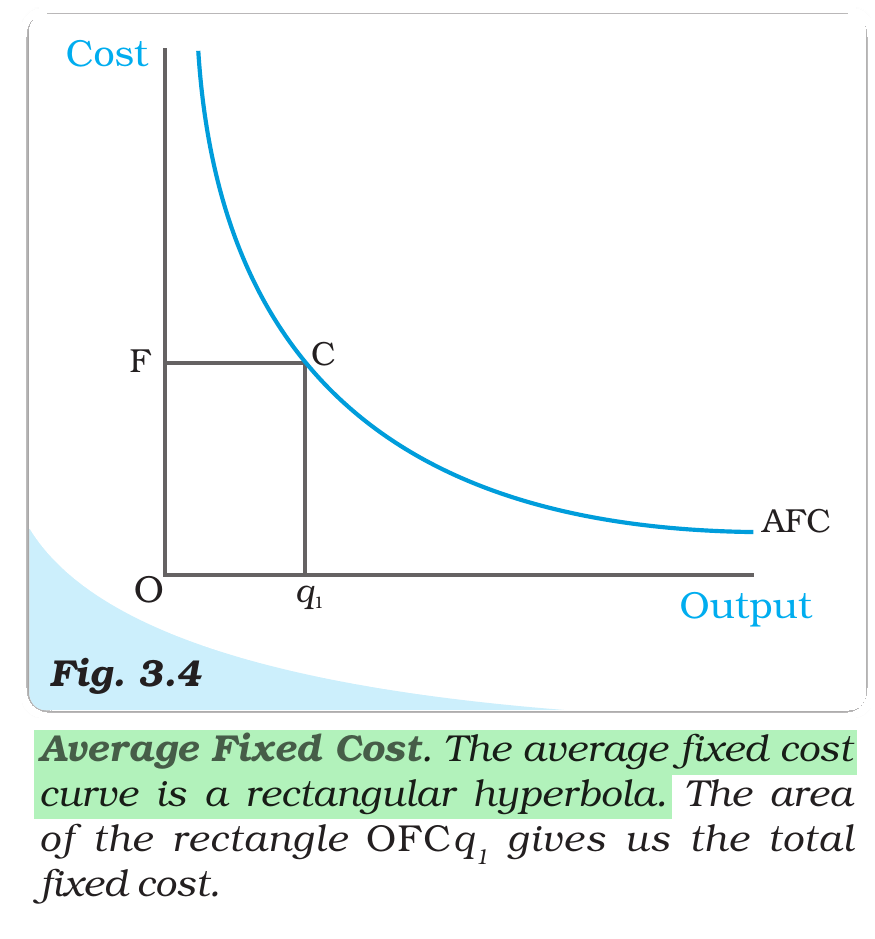
Total fixed cost (TFC) stays the same whatever the output. Average fixed cost (AFC) is this fixed amount spread over the units produced, so AFC = TFC/q. As output rises, AFC keeps falling. A fixed cost of Rs. 1,000 is Rs. 100 a unit at 10 units and Rs. 10 a unit at 100 units.
If we multiply any output by its AFC, we always get the same constant, TFC. So the AFC curve is a rectangular hyperbola. It is the TFC curve that is horizontal.
Note: A same/similar question was asked in CUET (UG) in the papers below.
| 2026 | 2025 | 2024 | 2023 | 2022 |
| – | 13-05 S1* 27-05 S2* 29-05 S2 02-06 S1* 03-06 S2* | – | – | – |
* A similar question.
NCERT (2026-27): “Shapes of the Short Run Cost Curves … We place output on the x-axis and costs on the y-axis. TFC is a constant which takes the value c1 and does not change with the change in output. It is, therefore, a horizontal straight line cutting the cost axis at the point c1. … … AFC is the ratio of TFC to q. TFC is a constant. Therefore, as q increases, AFC decreases. When output is very close to zero, AFC is arbitrarily large, and as output moves towards infinity, AFC moves towards zero. AFC curve is, in fact, a rectangular hyperbola. If we multiply any value q of output with its corresponding AFC, we always get a constant, namely TFC. Figure 3.4 shows the shape of average fixed cost curve for a typical firm.…”
|