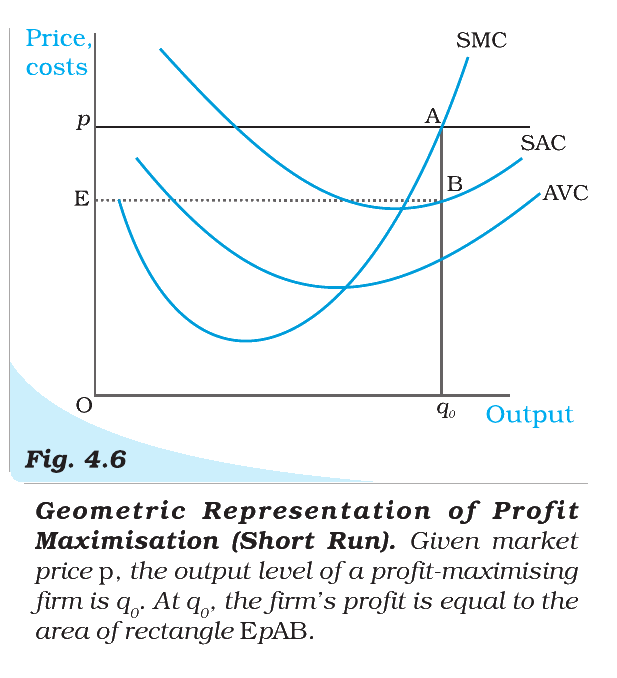
Given diagram is a Geometric Representation of Profit Maximisation (Short Run). Study the diagram given below and answer the question.
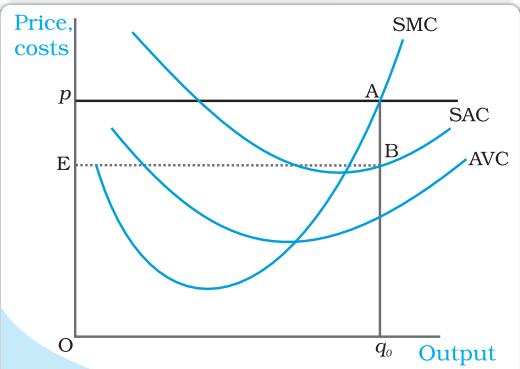
In the diagram, what does the vertical distance between the points A and B at the output q0 show?
Answer & explanation
Correct answer: option 2
The correct answer is Option (2) → The profit per unit of output at q0
At q0, A is at the height of the price and B at the height of short run average cost. So AB = price − average cost, the profit on each unit.
Option (1) The marginal cost of the unit q0 — Incorrect. At q0, price equals SMC, so marginal cost is the whole height Aq0, not AB.
Option (2) The profit per unit of output at q0 — Correct. Revenue per unit minus cost per unit.
Option (3) The total profit of the firm at q0 — Incorrect. Total profit is the area EpAB, which is AB multiplied by the output Oq0.
Option (4) The average variable cost at q0 — Incorrect. AVC lies below B, on the lower curve.
NCERT (2026-27): “4.3.4 The Profit Maximisation Problem: Graphical Representation … Consider Figure 4.6. Notice that the market price is p. Equating the market price with the (short run) marginal cost, we obtain the output level q0. At q0, observe that SMC slopes upwards and p exceeds AVC. Since the three conditions discussed in sections 3.1-3.3 are satisfied at q0, we maintain that the profit-maximising output level of the firm is q0. … The total revenue of the firm at q0 is the area of rectangle OpAq0 (the product of price and quantity) while the total cost at q0 is the area of rectangle OEBq0 (the product of short run average cost and quantity). So, at q0, the firm earns a profit equal to the area of the rectangle EpAB.”
|