CUET Preparation Today
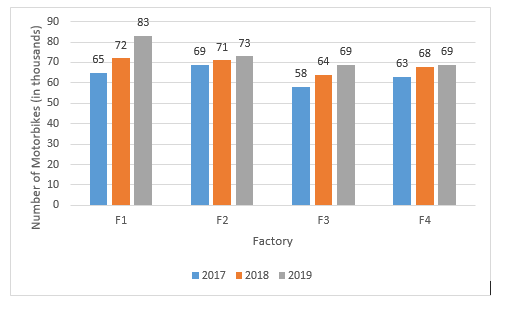
The following bar graph shows the sales (in thousands) of motor bikes by the factories, F1, F2, F3 and F4 in 2017, 2018 and 2019.
Which factory had the highest sales across all the years? |
F1 F2 F3 F4 |
F1 |
Total sale of F1 = 65 + 72 + 83 = 220 Total sale of F2 = 69 + 71 + 73 = 213 Total sale of F3 = 58 + 64 + 69 = 191 Total sale of F4 = 63 + 68 + 69 = 200 So , Total sale of F1 is highest. |