CUET Preparation Today
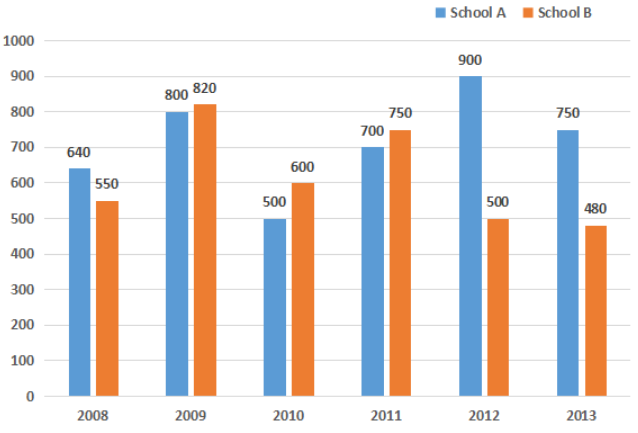
The given bar graph shows the number of students of two schools over a period of six years.
In the bar graph, in which year is the sum of the students from schools A and B taken together, the minimum? |
2010 2013 2011 2012 |
2010 |
Let's check one by one for each option , 1. 2010 Sum of students from school A & school B = 500 + 600 = 1100 2. 2013 1230 Sum of students from school A & school B = 750 + 480 = 1230 3. 2011 Sum of students from school A & school B = 700 + 750 = 1450 4. 2012 Sum of students from school A & school B = 900 + 500 = 1400 So , Sum is minimum for year 2010 i.e. 1100 |