CUET Preparation Today
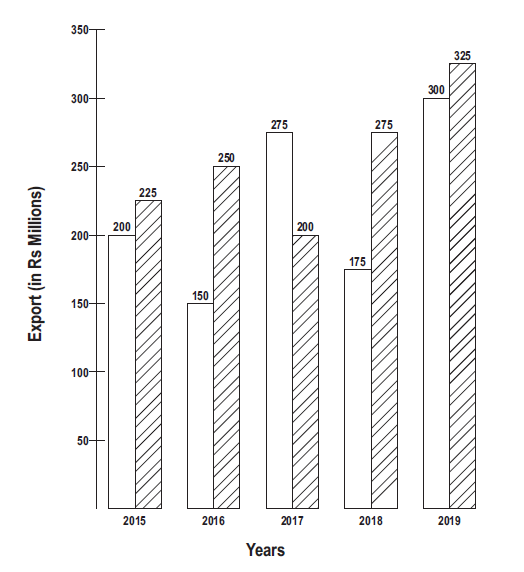
The bar graph shows the exports of Jeeps of type A and type B (in Rs. Million) from 2015 to 2019. A → Blank Bars B → Line Bars
What is the ratio of total exports of Jeep of type A in 2016 and 2017 to the total exports of Jeep of type B in 2015 and 2018? |
20 : 17 20 : 19 17 : 20 19 : 20 |
17 : 20 |
Export of Jeep of type A in 2016 and 2017 = 150 + 275 = 425 Export of Jeep of type B in 2015 and 2018 = 225 + 275 = 500 Ratio → 425 : 500 85 : 100 17 : 20 |