CUET Preparation Today
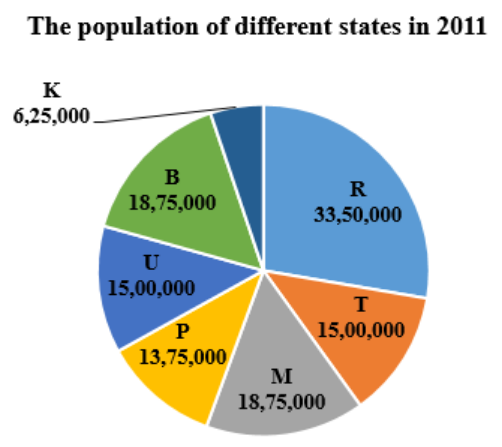
The following pie chart shows hypothetical populations of different states (K, R, T, M, P, U, B) in the year 2011.
What is the difference between the total population of R and T and the total population of U and B as per data given in the pie chart above? |
13,82,000 15,40,000 12,56,000 14,75,000 |
14,75,000 |
Difference b/w population of R & T to the population of U & B = ( 3350000 + 150000 ) - ( 1500000 + 1875000 ) = 1475000 |