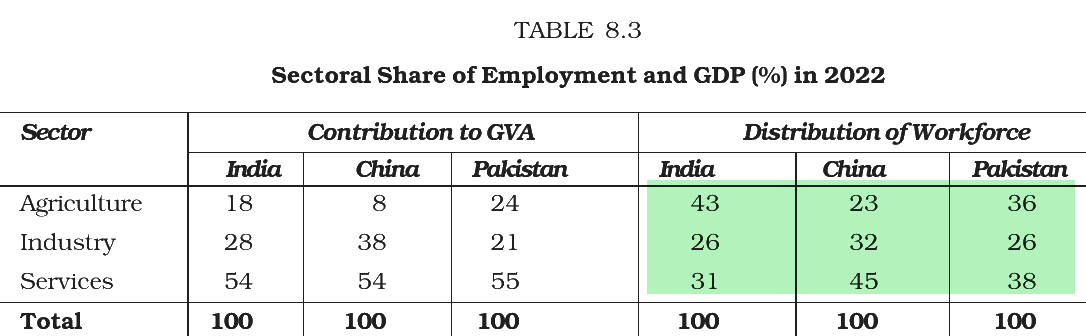
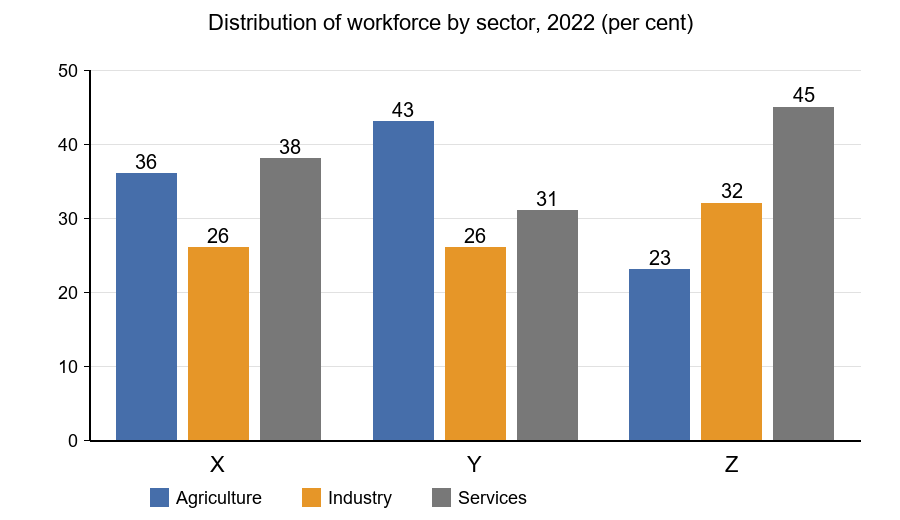
The chart shows the distribution of the workforce (per cent) across agriculture, industry and services in 2022 for India, China and Pakistan, marked X, Y and Z:
Identify X, Y and Z.
Answer & explanation
Correct answer: option 4
The correct answer is Option (4) → X – Pakistan; Y – India; Z – China
Read the share of the workforce in agriculture first; it is different for each country:
Y (43 per cent): India, which depends most on agriculture.
X (36 per cent): Pakistan, which also has 38 per cent in services.
Z (23 per cent): China, with the largest share in services (45 per cent) and in industry (32 per cent).
NCERT (2026-27): “8.4 Gross Domestic Product and Sectors … In both India and Pakistan, the contribution of agriculture to GVA were 18 and 24 per cent, respectively, but the proportion of workforce that works in this sector is more in India. In Pakistan, about 36 per cent of people work in agriculture, whereas, in India, it is 43 per cent. …” |