CUET Preparation Today
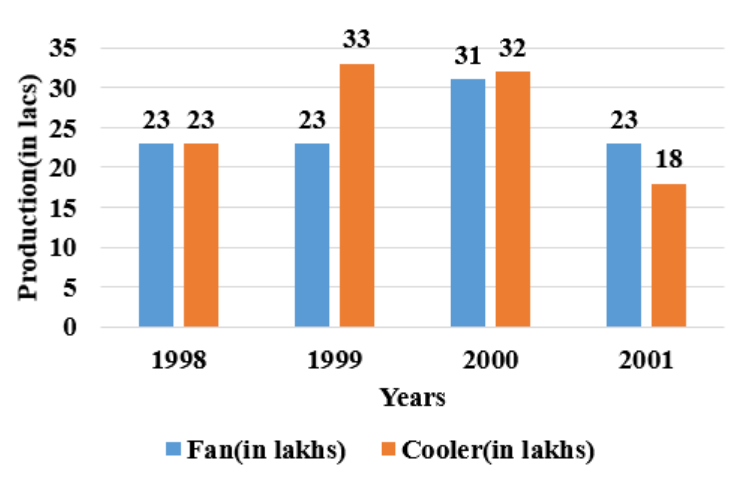
The following bar graph gives figures for the production of fans and of coolers by a large company in four consecutive years.
Calculate the ratio of the number of fans produced in 1998 to the number of coolers produced in 2001. |
23 : 18 32 : 18 23 : 21 18 : 23 |
23 : 18 |
Number of fans produced in 1998 : Number of coolers produced in 2001 23 : 18 |