CUET Preparation Today
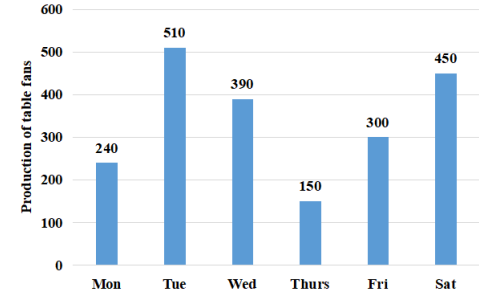
Study the given bar graph and answer the question that follows. The bar graph shows the production of table fans in a factory for one week.
The ratio of the total production of table fans on Tuesday and Wednesday together to that on Thursday and Friday together is: |
2 : 1 4 : 3 3 : 1 3 : 2 |
2 : 1 |
Total production of table fans on Tuesday and Wednesday : total production of table fans on Thursday and Friday ( 510 + 390 ) : ( 150 + 300 ) 900 : 450 2 : 1 |