CUET Preparation Today
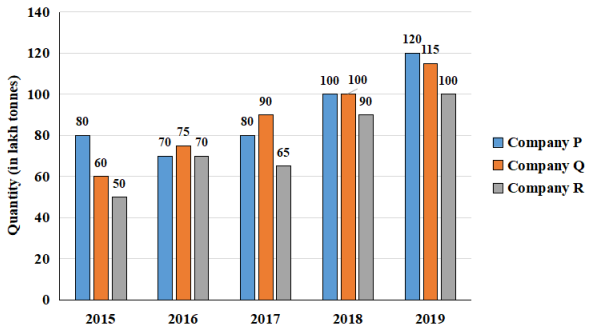
Study the given bar graph and answer the question that follows. The bar graph indicates the production of sugar (in lakh tonnes) by three different sugar companies P, Q and R over the years 2015 to 2019.
The percentage rise in the production of sugar by company Q as compared to the previous year is the maximum in the year: |
2017 2019 2016 2018 |
2016 |
Lets solve one by one for each option . 1. 2017 Percentage increase in production by Q in 2017 as compared to 2016 = \(\frac{90-75 }{75}\) × 100 = \(\frac{15 }{75}\) × 100 = 20% 2. 2015 Percentage increase in production by Q in 2015 as compared to 2014 = \(\frac{115-100 }{100}\) × 100 = \(\frac{15 }{100}\) × 100 = 15% 3. 2016 Percentage increase in production by Q in 2016 as compared to 2015 = \(\frac{75-60 }{60}\) × 100 = \(\frac{15 }{60}\) × 100 = 25% 4. 2018 Percentage increase in production by Q in 2018 as compared to 2017 = \(\frac{100-90 }{90}\) × 100 = \(\frac{1 }{9}\) × 100 = 11.11% So , Percentage increase in production by Q is maximum in 2016 as compared to 2015 . Ans :- 2016 |