CUET Preparation Today
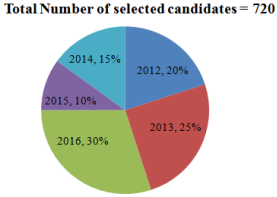
The Pie-chart given here shows the percentage of candidates selected in an Examination from 2012 to 2016.
Total selected candidates in 2015 is how much percentage less than the total selected candidates in 2013? |
45% 60% 50% 40% |
60% |
Total selected candidates in 2015 = 10% Total selected candidates in 2013 = 25% Required percentage = \(\frac{25-10}{25}\) × 100 = \(\frac{15}{25}\) × 100 = 60% |