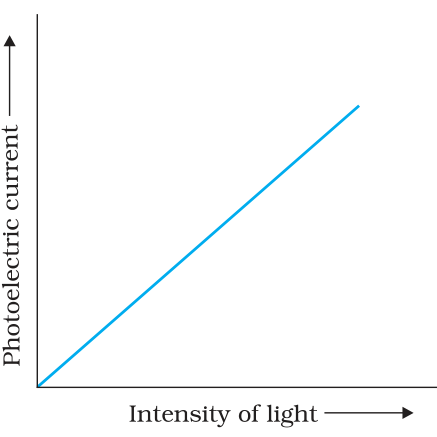
The graph showing correct variation of photo current with intensity of incident light:
Answer & explanation
Correct answer: option 2
The correct answer is Option (2)
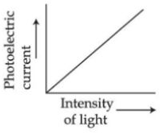
The intensity of light is the energy falling per unit area per second; for light of a given frequency it fixes the number of photons arriving per second. When the frequency is above the threshold, each absorbed photon can free one electron.
So the number of photoelectrons emitted per second, and hence the photoelectric current, is directly proportional to the intensity.
\( \displaystyle I_{\mathrm{photo}} \propto \text{intensity} \)
The graph is a straight line through the origin: no light gives no current, and emission starts at once for even a weak beam, because there is no threshold intensity. This is the graph of Option (2).
Note: A similar question was also asked in CUET (UG) 2026 on 06-06-2026 (Slot 1).
NCERT (2026-27):
Effect of Intensity of Light on Photocurrent – “… It is found that the photocurrent increases linearly with intensity of incident light as shown graphically in Fig. 11.2. The photocurrent is directly proportional to the number of photoelectrons emitted per second.”