CUET Preparation Today
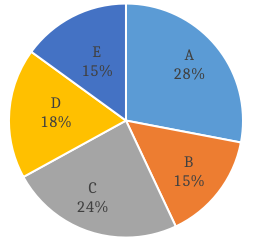
The given pie chart shows the percentage of students in five schools and the table shows the ratio of boys and girls in each school. Study the pie chart and table and answer the question that follows.
The below table shows the ratio of girls and boys in the given five schools.
The number of girls in school D is what percentage less than the number of boys in school B (correct to the nearest integer)? |
35% 19% 27% 33% |
33% |
Number of girls in school D = \(\frac{1}{3}\) × 18 = 6 Number of boys in school B = \(\frac{3}{5}\) × 15 = 9 Required percentage = \(\frac{3}{9}\) × 100 = 33.33% = 33% ( nearest integer ) |