CUET Preparation Today
Study the given graph and answer the question that follows.
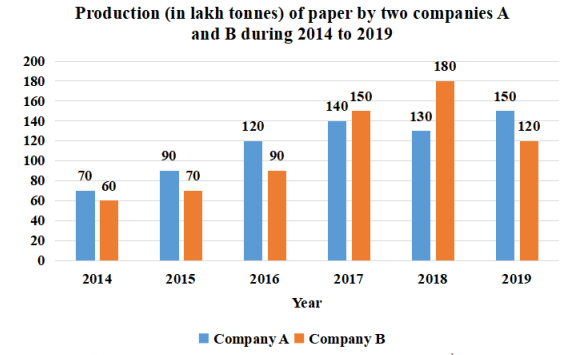
The average production of paper by company B in 2014, 2017 and 2018 was 13\(\frac{1 }{4}\)% less than the production of paper by company A in the year: |
2016 2018 2017 2019 |
2019 |
Average production of paper by company B in 2014, 2017 and 2018 = \(\frac{60 + 150 + 180 }{3}\) = \(\frac{ 390 }{3}\) = 130 lakh tonnes average production of B in 2014 , 2017 & 2018.13\(\frac{ 1 }{4}\)% less than production of company A in a year . SO , production of A = \(\frac{100 }{86.75}\) × 130 = 149.85 lakh tonnes = 150 lakh tonnes ( approx ) By carefully observing the chart . we find that production of company A in year 2019 is also 150 lakh tonnes. Ans :- 2019
|