CUET Preparation Today
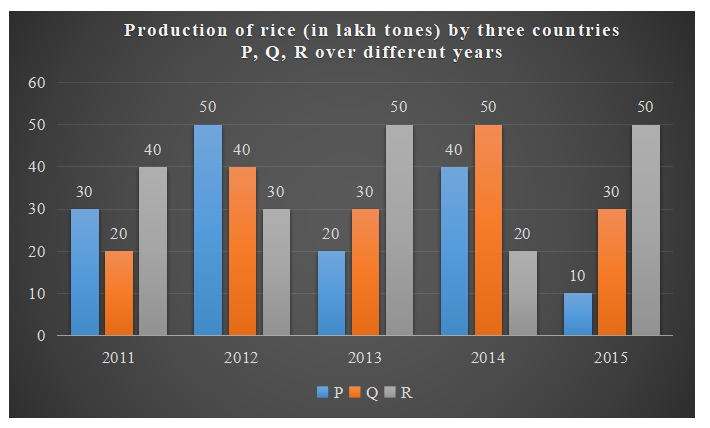
The given bar graph shows the data of the production of rice (in lakh tons) by three different countries P, Q and R over the years mentioned. Study the graph and answer the question that follows.
The average production for the five years is maximum for which country ?
|
Only Q P and Q P and R Only R |
Only R |
Average production of P for five years = \(\frac{30 + 50 + 20 + 40 + 10 }{5}\) = \(\frac{150}{5}\) = 30 Average production of Q for all 5 years = \(\frac{20 + 40 + 30 + 50 + 30}{5}\) = \(\frac{170}{5}\) = 34 Average production of R for all five years = \(\frac{40 + 30 + 50 + 20 + 50}{5}\) = \(\frac{190}{5}\) = 38 So , R has maximum production. |