
Which of the following curve gives the variation of \(\Lambda _m\) with \(\sqrt{c}\) for \(CH_3COOH\).
Answer & explanation
Correct answer: option 4
The correct answer is Option (4) → Λm vs √c curve of a weak electrolyte
Molar conductivity increases on dilution for every electrolyte, but the shape of the Λm vs √c plot depends on the type of electrolyte:
Strong electrolytes (KCl) are fully ionised at all concentrations; Λm rises slowly on dilution and the plot is a straight line, Λm = Λ°m − A√c.
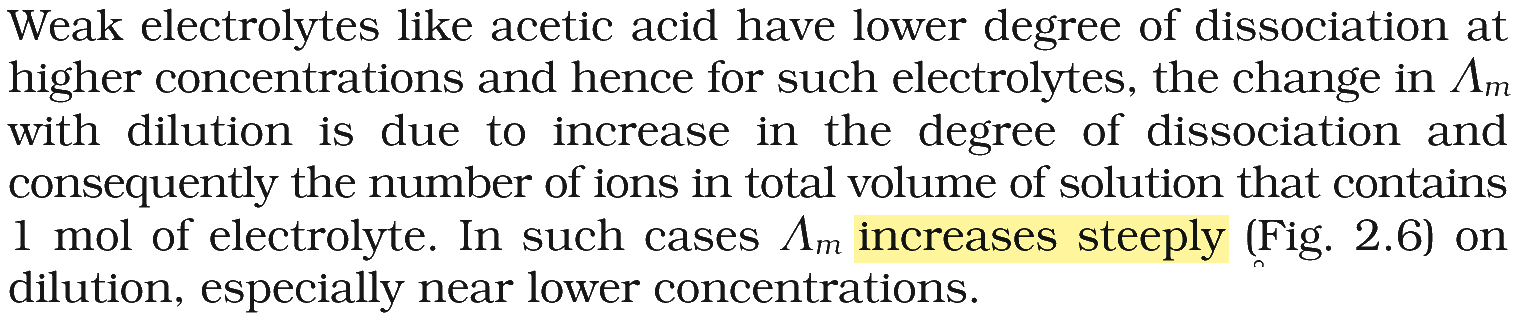
Weak electrolytes (\( \ce{CH3COOH} \)) are only partly ionised. On dilution their degree of dissociation increases, so the number of ions per mole rises and Λm increases steeply near low concentrations. The plot is a curve, high at low √c and falling sharply as √c increases.
Why the other options are incorrect
Option (1) — Incorrect. The axes are interchanged (√c on the y-axis) and the plot is a straight line, the pattern of a strong electrolyte, not of acetic acid.
Option (2) — Incorrect. Λm rises as √c rises, i.e. it would fall on dilution; that is the reverse of the behaviour of every electrolyte.
Option (3) — Incorrect. The axes are interchanged and the line is straight; it shows no steep rise of Λm at low concentration.
NCERT (2026-27 edition):
Weak Electrolytes
Note: The same/similar question has been asked in different years by NTA as per the details given below:
| 2026 | 2025 | 2024 | 2023 | 2022 |
|---|---|---|---|---|
| – | – | – | 01-06 S3 24-05 S3 | – |