CUET Preparation Today
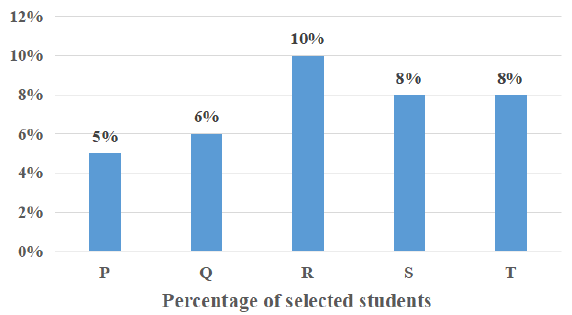
The following bar graph shows the percentage of students from five different colleges who are selected for a maths quiz.
The ratio of the number of students in colleges P, Q, R, S and T is 2 : 4 : 3 : 1 : 3, respectively. If 25 students are selected from college P, then what is the total number of students selected for the quiz? |
172 180 240 210 |
240 |
Number of selected students in P = 5% of total students in P ATQ, 5% of total students in P = 25 Total number of students in P = 500 Ratio of the number of students in colleges P, Q, R, S and T is 2 : 4 : 3 : 1 : 3 Total number of students in Q = \(\frac{500 }{2}\) × 4 = 1000 Total number of students in R = \(\frac{500 }{2}\) × 3 = 750 Total number of students in S = \(\frac{500 }{2}\) × 1 = 250 Total number of students in T = \(\frac{500 }{2}\) × 3 = 750 Total number of selected students = \(\frac{5 }{100}\) × 500 + \(\frac{6 }{100}\) × 1000 + \(\frac{10}{100}\) × 750 + \(\frac{8 }{100}\) × 250 + \(\frac{8}{100}\) × 750 = 25 + 60 + 75 + 20 + 60 = 240 |