CUET Preparation Today
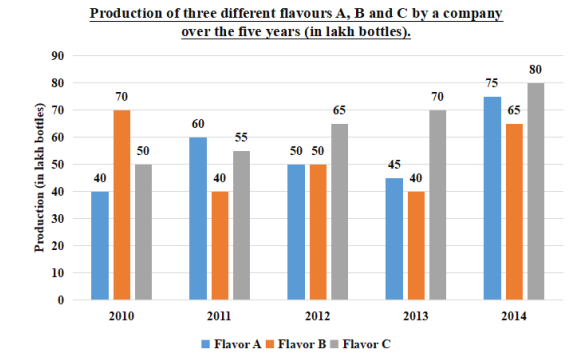
Study the given bar graph and answer the question that follows. A soft drink company prepares drinks of three different flavours A, B and C. The bar graph shows the production of three flavours over a period of five years from 2010 to 2014.
For which of the following years. is the percentage of the rise in production compared to its previous year the maximum with respect to flavour C? |
2013 2012 2014 2011 |
2012 |
Lets solve one by one for each option . 1. 2013 Percentage increase in production of C in 2013 as compared to 2012 = \(\frac{70-65 }{65}\) × 100 = \(\frac{1 }{13}\) × 100 = 7.69% 2. 2012 Percentage increase in production of C in 2012 as compared to 2011 = \(\frac{65-55 }{55}\) × 100 = \(\frac{1 }{11}\) × 100 = 9.09% 3. 2014 Percentage increase in production of C in 2014 as compared to 2013 = \(\frac{80-70 }{70}\) × 100 = \(\frac{1 }{7}\) × 100 = 14.28% 4 . 2011 Percentage increase in production of C in 2011 as compared to 2010 = \(\frac{55-50 }{50}\) × 100 = \(\frac{1 }{10}\) × 100 = 10% So , Percentage increase in production of C in 2014 as compared to 2013 is maximum . Ans :- 2014 |