CUET Preparation Today
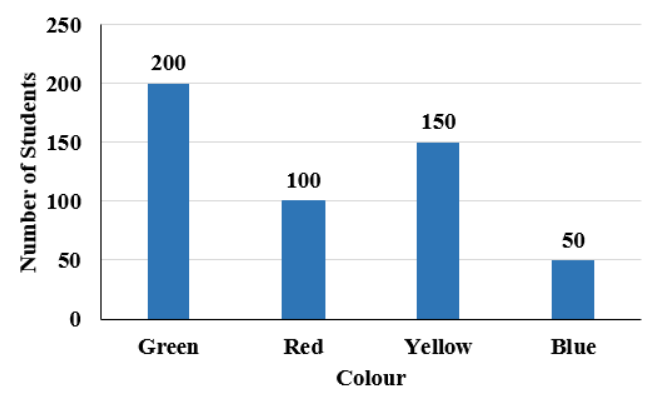
The following bar graph shows the number of students who like four different colours.
Find the difference between the number of students who like yellow and those who liked blue. |
100 125 50 60 |
100 |
difference between the number of students who like yellow to blue = 150 - 50 = 100 |