CUET Preparation Today
CUET
Section B2
Numbers, Quantification and Numerical Applications
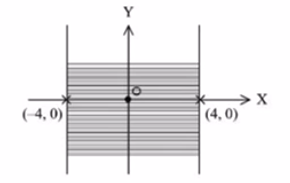
The inequality that represents the following graph is :
$|x|≤3$
$|x|≤4$
$|x|≥3$
$|x|≥4$
The correct answer is Option (2) → $|x|≤4$
The inequality represented in graph is,
$-4≤x≤4⇒|x|≤4$