CUET Preparation Today
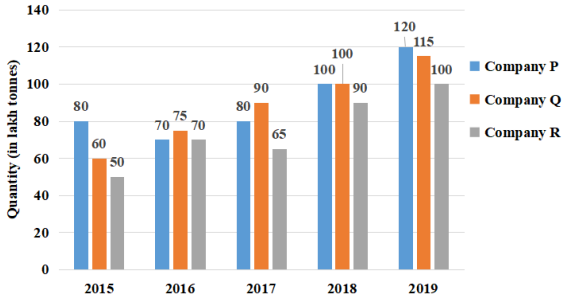
The given bar graph indicates the production of sugar (in lakh tonnes) by three different sugar companies P, Q and R from the year 2015 to 2019. Study the bar graph and answer the question that follows. Production of sugar by companies P, Q and R from 2015 to 2019
The percentage increase in the production of sugar by company P in 2019 as compared to 2015 is: |
50% 45% 40% 60% |
50% |
Production of sugar by company P in 2015 = 80 Production of sugar by company P in 2019 = 120 Percentage increase in production = \(\frac{120-80 }{80}\) × 100 = \(\frac{40 }{80}\) × 100 = 50%
|