CUET Preparation Today
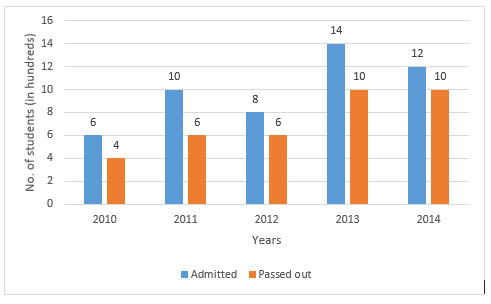
The bar graph shows the number of students (in hundreds) admitted and passed out per year in a college during the years 2010 to 214. Study the bar-graph and answer the question.
In which of the following years, was the pass percentage between 80 and 85? |
2014 2011 2013 2012 |
2014 |
Lets solve one by one for each option , 1. 2014 Number of admitted students in 2014 = 12 Passed students = 10 Pass percentage = \(\frac{10}{12 }\) × 100 = 83.33% 2. 2011 Number of admitted students in 2011 = 10 Passed students = 6 Pass percentage = \(\frac{6}{10 }\) × 100 = 60% 3. 2013 Number of admitted students in 2013 = 14 Passed students = 10 Pass percentage = \(\frac{10}{14 }\) × 100 = 71.4% 4. 2012 Number of admitted students in 2012 = 8 Passed students = 6 Pass percentage = \(\frac{6}{8 }\) × 100 = 75% So , pass percentage in year 2014 is b/w 80 and 85. Ans :- 2014 |