
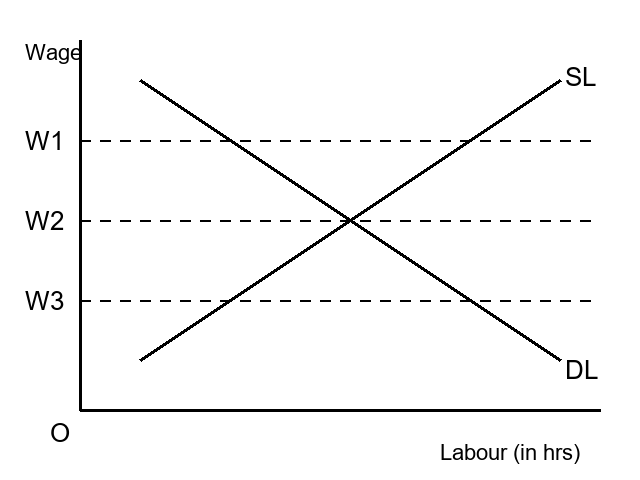
The figure shows the demand curve (DL) and the supply curve (SL) of labour in a perfectly competitive labour market. Three wage rates are marked W1, W2 and W3. Which of the following is correct?
Answer & explanation
Correct answer: option 4
The correct answer is Option (4) → W2 is the equilibrium wage; at W1 there is an excess supply of labour
The equilibrium wage is where the labour demand curve DL and the labour supply curve SL cross. In the figure, that is W2.
At W1, above W2, households wish to supply more hours than firms wish to hire. That is an excess supply of labour. At W3, below W2, firms wish to hire more hours than households supply, so there is excess demand.
NCERT (2026-27): “5.1 Equilibrium, Excess Demand, Excess Supply … If at a price, market supply is greater than market demand, we say that there is an excess supply in the market at that price and if market demand exceeds market supply at a price, it is said that excess demand exists in the market at that price. Therefore, equilibrium in a perfectly competitive market can be defined alternatively as zero excess demand-zero excess supply situation.” “Wage Determination in Labour Market … With an upward sloping supply curve and downward sloping demand curve, the equilibrium wage rate is determined at the point where these two curves intersect; in other words, where the labour that the households wish to supply is equal to the labour that the firms wish to hire. This is shown in the diagram.” |