CUET Preparation Today
The given pie charts represent the distribution of candidates who enrolled for a bank clerical examination and the candidates (out of those enrolled) who passed the examination. from five different institutes P, Q, R, S and T. Study the pie charts and answer the question that follows. (i) Total number of candidates who enrolled for the examination from five institutes = 5500
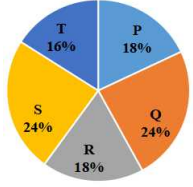
(ii) Total number of candidates who passed the examination from five institutes = 3300
The average number of candidates passed from institutes P and Q together is what percentage of the total number of candidates enrolled from institutes P and Q together? |
30% 31.5% 25.8% 24.6% |
31.5% |
Average number of candidates passed from institutes P and Q = \(\frac{1 }{2}\) × \(\frac{18+24 }{100}\) × 3300 = \(\frac{1 }{2}\) × \(\frac{ 42 }{100}\) × 3300 = 693 Total number of candidates enrolled from P & Q = \(\frac{20+20 }{100}\) × 5500 = \(\frac{2 }{5}\) × 5500 = 2200 Required percentage = \(\frac{693}{2200}\) × 100 = 31.5% |