CUET Preparation Today
Study the given graph and answer the following question.
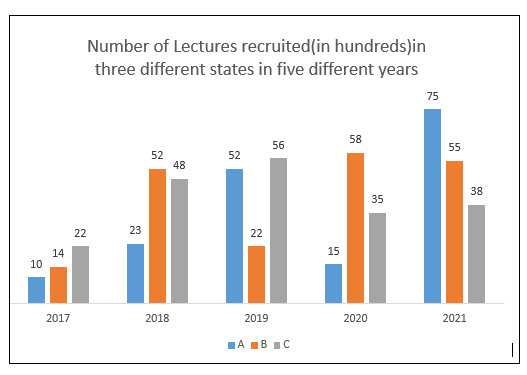
The number of lectures recruited in state A in the year 2017 was what percentage of the number of lectures recruited in state B in the year 2019 ? (Correct to 2 decimal places ) |
42.50% 36.25% 45.45% 56.23% |
45.45% |
Number of lectures recruited in state A in 2017 = 10 Number of lectures recruited in state B in 2019 = 22 Required percentage = \(\frac{10}{22}\) × 100 = 45.45% |