CUET Preparation Today
CUET
General Aptitude Test
Quantitative Reasoning
Data Interpretation & Stats
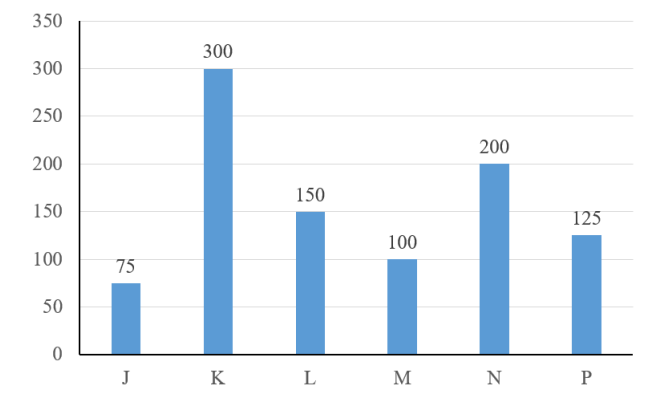
The bar graph given below shows the salary of 6 employees of a company.
What is the ratio of the salary of J to the salary of M?
4 : 3
3 : 4
5 : 7
2 : 5
Salary of J : Salary of M
75 : 100