CUET Preparation Today
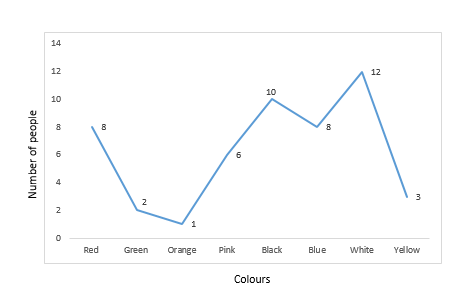
The following line graph shows the favourite colour of a group of people. What percent of the total number of people like black colour?
|
50 % 20 % 10 % 33.3 % |
20 % |
Total number of person = 50 Person with favourite color Black = 10 Percentage of people with black color favourite = \(\frac{10}{50}\) × 100 = 20% |