CUET Preparation Today
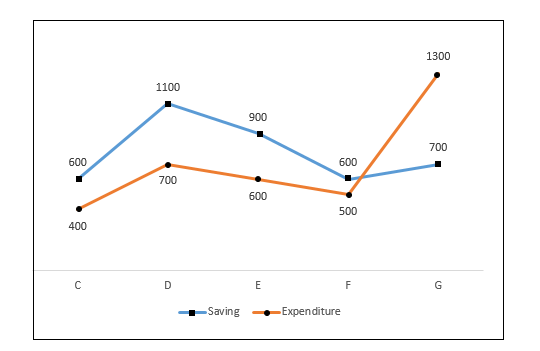
The line chart given below shoes the savings and expenditure of 5 companies C, D, E, F and G.
Income = Saving + Expenditure What is the ratio of total expenditure to the total incomes of all the companies ? |
31 : 71 74 : 35 71 : 31 35 : 74 |
35 : 74 |
Total expenditure = 400 + 700 + 600 + 500 + 1300 = 3500 Total income = 3500 + 600 + 1100 + 900 + 600 + 700 = 7400 Ratio of total expenditure to total income , = 3500 : 7400 = 35 : 74 |