CUET Preparation Today
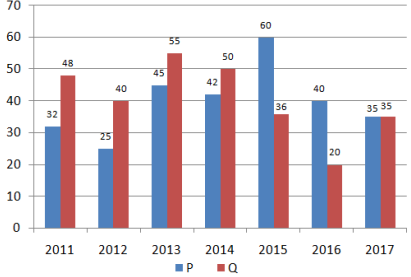
The Bar graph shows the profit(Rupees in Lakhs) earned by two companies p and q during the period 2011 to 2017.
In which year company P earns the maximum profit as compared to the previous year? |
2013 2016 2017 2015 |
2013 |
In 2012 , there is decrease in profit comparative to previous year. In 2013 , Increase in profit = 45 - 25 = 20 In 2014 , there is decrease in profit comparative to previous year. In 2015 , Increase in profit = 60 - 42 = 18 In 2016 , there is decrease in profit comparative to previous year. In 2017 , there is decrease in profit comparative to previous year. So , In year 2013 there is maximum increase in profit as compared to previous year . |