CUET Preparation Today
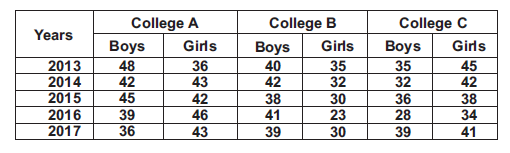
The data given in table shows the no. of boys and girls in enrolled 3 different colleges in 5 years.
Number of boys in college B is what percentage of number of boys in college A in the year from 2013 to 2017? |
85.7% 89.5% 95.23% 97.28% |
95.23% |
No. of boys in College B = 40 + 42 + 38 + 41 + 39 = 200 No. of boys in College A = 48 + 42 + 45 + 39 + 36 = 210 Required percentage = \(\frac{200}{210}\) × 100 = 95.23% |