CUET Preparation Today
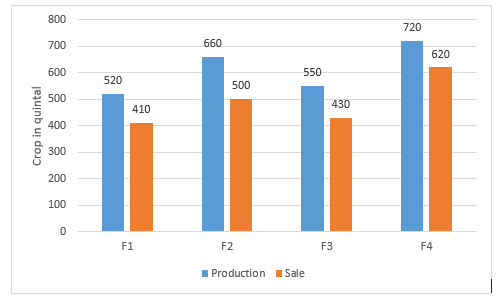
The given bar graph represents the production and sales of a certain crop in quintals by the farmers F1, F2, F3 and F4.
What is the percentage less in the production by farmer F1 with respect to the production by farmer F2? |
$21\frac{7}{33}$% $23\frac{7}{33}$% $22\frac{7}{33}$% $24\frac{7}{33}$% |
$21\frac{7}{33}$% |
Production by farmer F1 = 520 Production by Farmer F2 = 660 Less percentage of production by F1 than to F2 = \(\frac{660-520 }{660}\) × 100 = \(\frac{140 }{660}\) × 100 = 21\(\frac{7}{33}\)% |