CUET Preparation Today
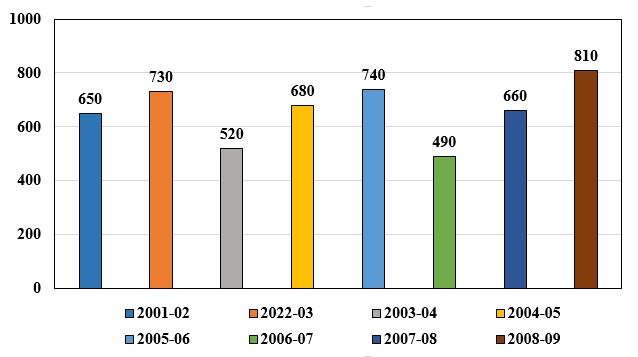
The given bar graph shows the profit (in ₹ lakhs) made by a company from 2001-2002 to 2008-2009.
The ratio of the number of years in which the company's profit is above the average profit, to those in which the profit is below the average is: |
5 : 3 4 : 3 3 : 5 3 : 4 |
4 : 3 |
Average profit = \(\frac{ 650 + 730 + 520 + 680 + 740 + 490 + 660 + 810 }{8}\) = \(\frac{ 5280}{8}\) = 660 |