CUET Preparation Today
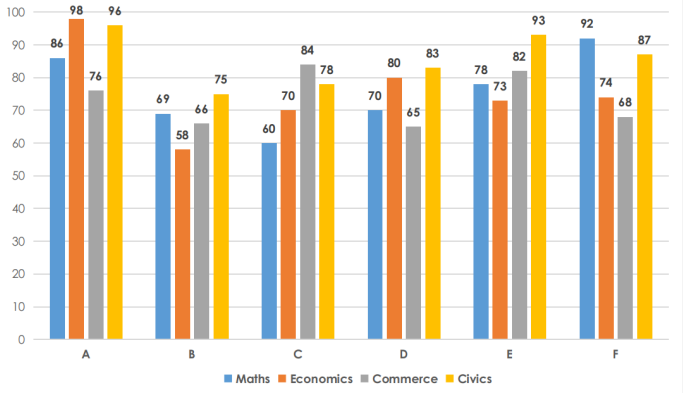
The following bar graph shows the marks (out of 100) of students A, B, C, D, E and in the subjects mentioned.
Based on this, only 2 students crossed the average marks in the subject: |
Maths Economics Commerce Civics |
Economics |
In maths , Average marks in Maths = \(\frac{86+69+60+70+78+92}{6}\) = \(\frac{ 455}{6}\) = 75.83 3 students have more marks than average. In economics , Average marks in Economics = \(\frac{98+58+70+80+73+74}{6}\) = \(\frac{ 453}{6}\) = 75.5 2 students have more marks than average. In Commerce , Average marks in Coomerce = \(\frac{76+66+84+65+82+68}{6}\) = \(\frac{ 441}{6}\) = 73.5 3 students have more marks than average. In civics, Average marks in civics = \(\frac{96+75+78+83+93+87}{6}\) = \(\frac{ 512 }{6}\) = 85.3 3 students have more marks than average. Ans :- Economics
|