
Which of the following graph shows the relationship between Susceptibility \( (\chi) \) and Temperature (T) for a paramagnetic material.
Answer & explanation
Correct answer: option 3
The correct answer is Option (3)
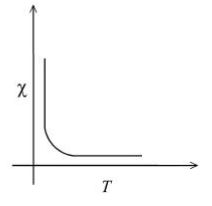
The susceptibility of a paramagnetic material obeys Curie’s law. Thermal motion disturbs the alignment of the atomic dipoles, so a hotter sample is less magnetised.
\( \displaystyle \chi = \frac{C\mu_0}{T} \Rightarrow \chi \propto \frac{1}{T} \)
The graph of \( \chi \) against T is therefore a falling curve: large at low temperature and tending towards zero, without reaching it, at high temperature, as in Option (3).
NCERT (2026-27):
Paramagnetism – “… For a paramagnetic material both χ and μr depend not only on the material, but also (in a simple fashion) on the sample temperature. As the field is increased or the temperature is lowered, the magnetisation increases until it reaches the saturation value at which point all the dipoles are perfectly aligned with the field.”