CUET Preparation Today
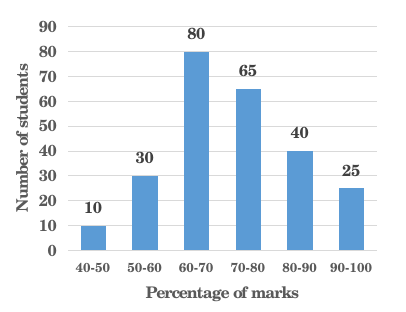
Study the histogram and answer the question given below. The graph represents the number of students obtaining a percentage of marks in class X Board examination in 2018 in a school.
The number of students who have secured less than 60% marks is what per cent less than the number of students who have secured 80% marks and above? |
37.4% 38.5% 33.5% 29.7% |
38.5% |
Number of students with less than 60% marks = 10 + 30 = 40 Number of students with 80% marks and above = 40 + 25 = 65 Required percentage = \(\frac{65 - 40}{65}\) × 100 = \(\frac{25}{65}\) × 100 = 38.5% |