CUET Preparation Today
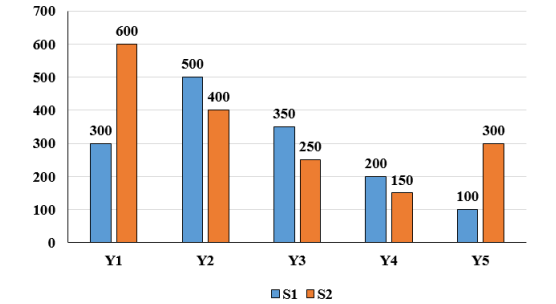
The bar graph given below shows the population of two states S1 and S2 in 5 years?
Which of the following statement is correct? I. The ratio of population of S1 to the population of S2 in the year Y1 are 3 : 1. II. The population of S1 is 140 percent of the population of S2 in the year Y3. |
Both I and II Neither I nor II Only II Only I |
Only II |
I. The ratio of population of S1 to the population of S2 in the year Y1 are 3 : 1. = 300 : 600 = 1 : 2 Statement I is not correct. II. The population of S1 is 140 percent of the population of S2 in the year Y3. Required percentage = \(\frac{350}{250}\) × 100 = 140% Statement II is correct. |